Data Analytics Solutions
Transform your business data into actionable insights with our comprehensive analytics solutions
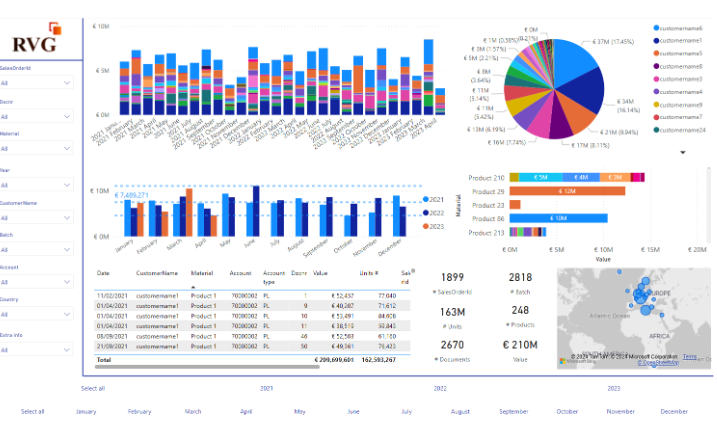
Interactive Dashboards
Our interactive financial dashboards provide real-time insights into your business performance. Track key metrics, analyze trends, and make data-driven decisions with confidence using our customizable visualization tools.
- Real-time financial metrics tracking
- Customizable visualization options
- Automated reporting and analysis
- Intuitive and user-friendly interface
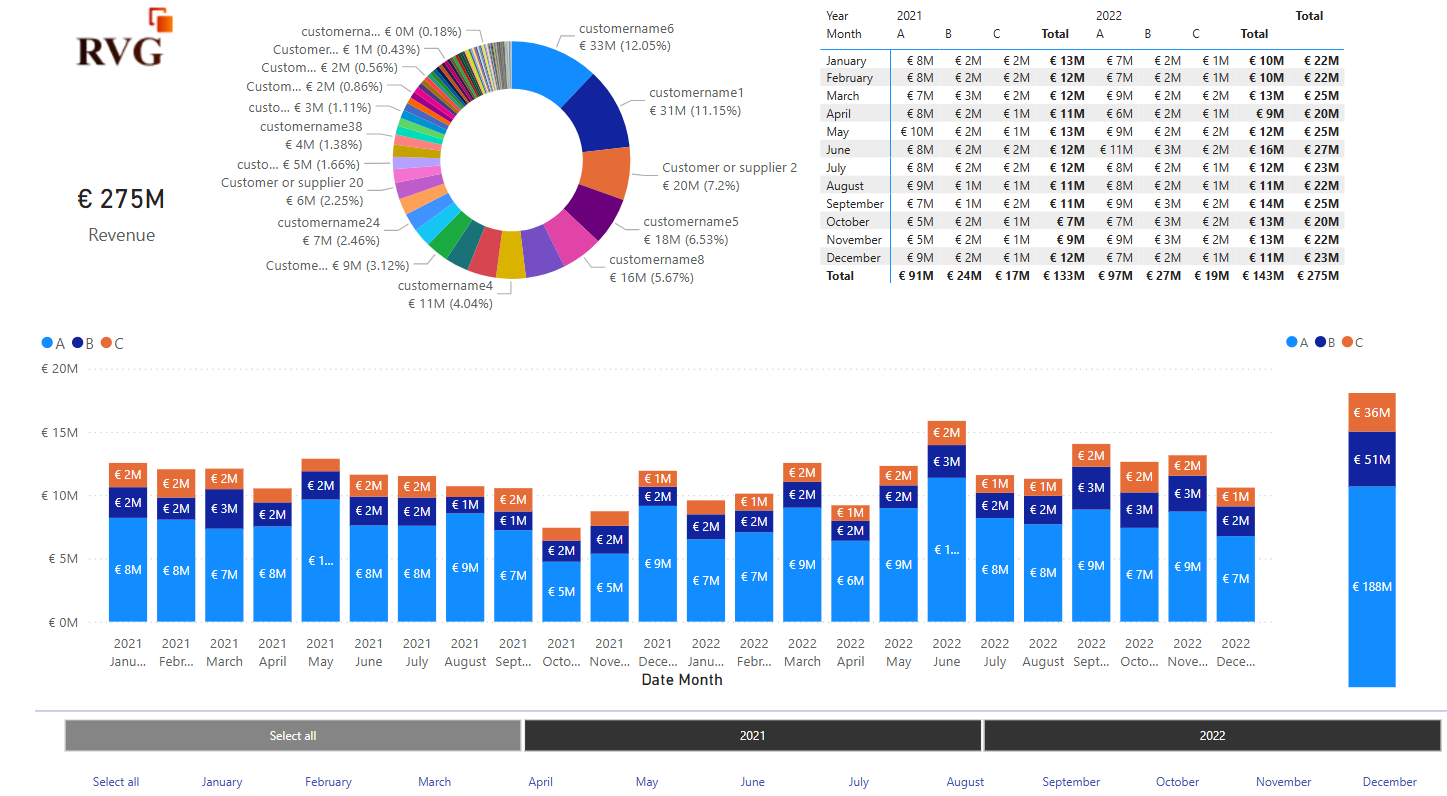
Financial Analytics
Our interactive financial dashboards provide real-time insights into your business performance. Track key metrics, analyze trends, and make data-driven decisions with confidence using our customizable visualization tools.
- Real-time financial metrics tracking
- Customizable visualization options
- Automated reporting and analysis
- Intuitive and user-friendly interface
Custom Reporting
Our interactive financial dashboards provide real-time insights into your business performance. Track key metrics, analyze trends, and make data-driven decisions with confidence using our customizable visualization tools.
- Real-time financial metrics tracking
- Customizable visualization options
- Automated reporting and analysis
- Intuitive and user-friendly interface